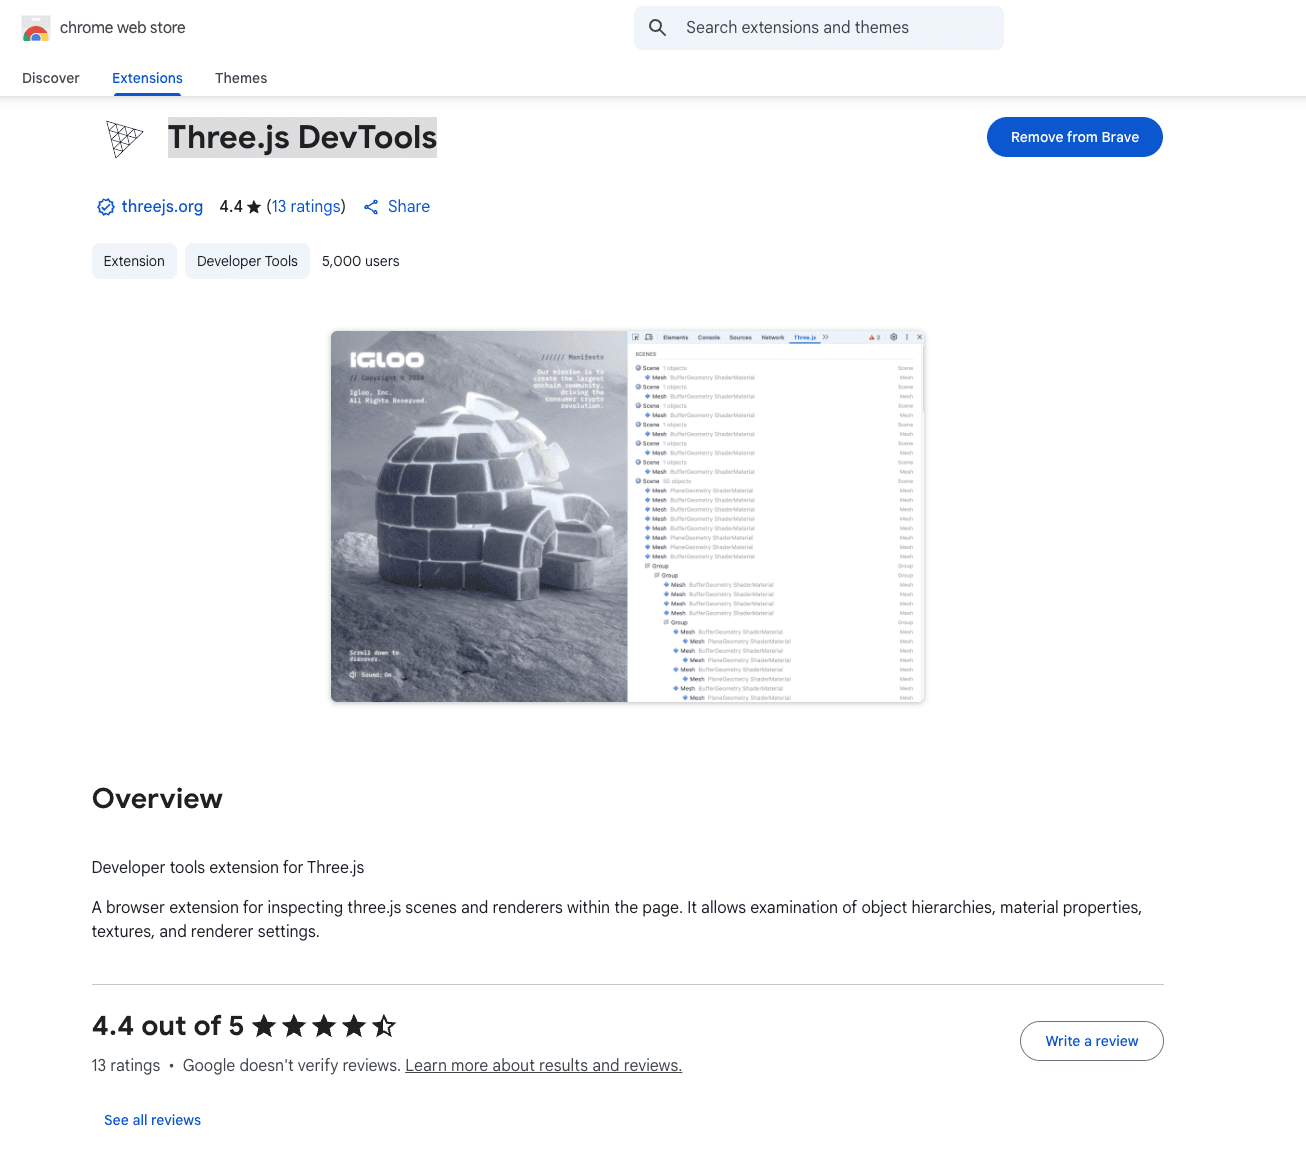
Three.js DevTools
Browser extension for inspecting Three.js scenes, materials, textures, and renderer settings.
mrdoob
Three.js Marketplace
Three.js Marketplace
Kickstart your Three.js and React Three Fiber (R3F) projects with our free and premium components themes and tools. Designed for freelancers, developers, and agencies, each product includes essential features to get you up and running quickly.
Web Development
Help with your project?
Custom Three.js, WebGL, and WebGPU development — from product visualizers to interactive 3D websites.
Links
Featured Badge
Add this badge to your website to show you are featured on Three.js Resources.
Description
Three.js DevTools is a Chrome extension that lets developers inspect and debug Three.js scenes directly in the browser. With its dedicated panel in Developer Tools, users can explore the entire scene graph, adjust object properties, review material and texture details, and monitor renderer stats such as draw calls and memory usage. Updated as recently as July 2025, this extension remains experimental and requires Three.js scenes and renderers to explicitly register themselves with the tool. Despite limited updates and maintenance, it remains a useful option for debugging real-time 3D applications built with Three.js.github.com
Features:
Interactive scene graph inspection with object hierarchy and real-time property editing
View and tweak materials, textures, shaders, light properties, and transform values
Render stats overview (renderer information, draw calls, triangles, memory usage)
Experimental alpha-state extension—requires explicit registration via global devtools hooks
Ideal Use Cases:
Debugging and optimizing Three.js scenes
Inspecting materials, lights, and renderer performance metrics
Small to medium web graphics projects that register with the tool
Developers working with Three.js and seeking visual debugging support
Why Use This Tool?
For developers building with Three.js, this extension adds a visual layer of debugging capability directly in the browser—making it easier to understand and fine-tune scene setup, lighting, and rendering workflows.
Sponsors

Related Resources
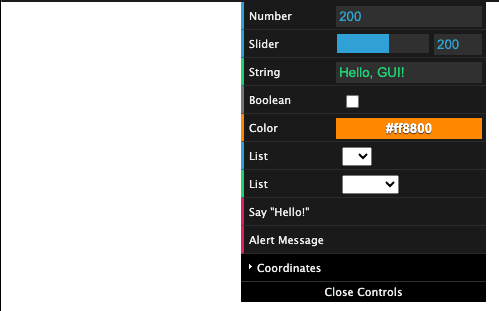
Dat.gui
dat.GUI is a lightweight controller library for real-time adjustments in three.js resources.
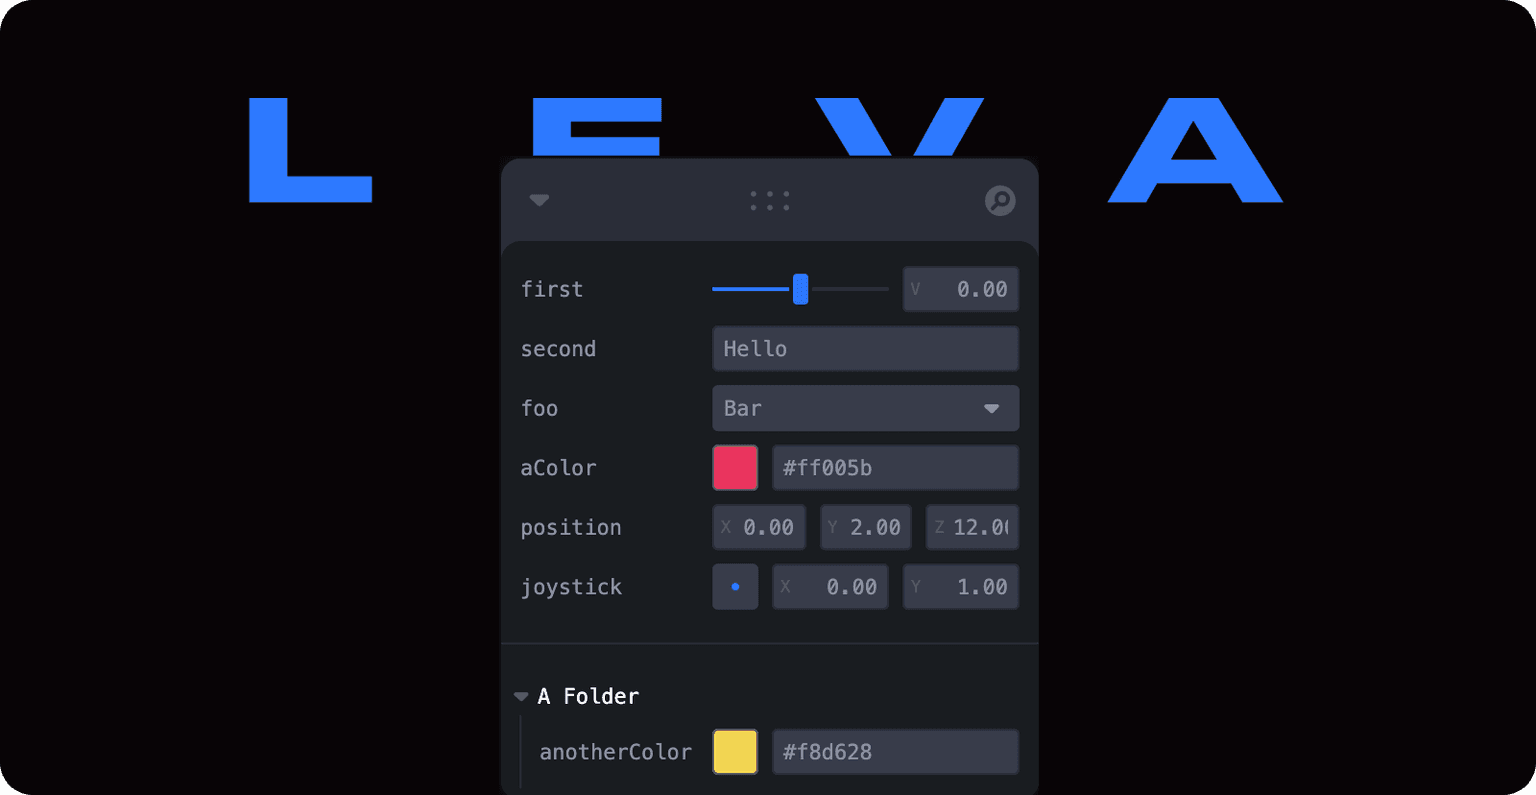
Leva
Leva is a GUI library for creating intuitive controls in three.js resources and web projects.
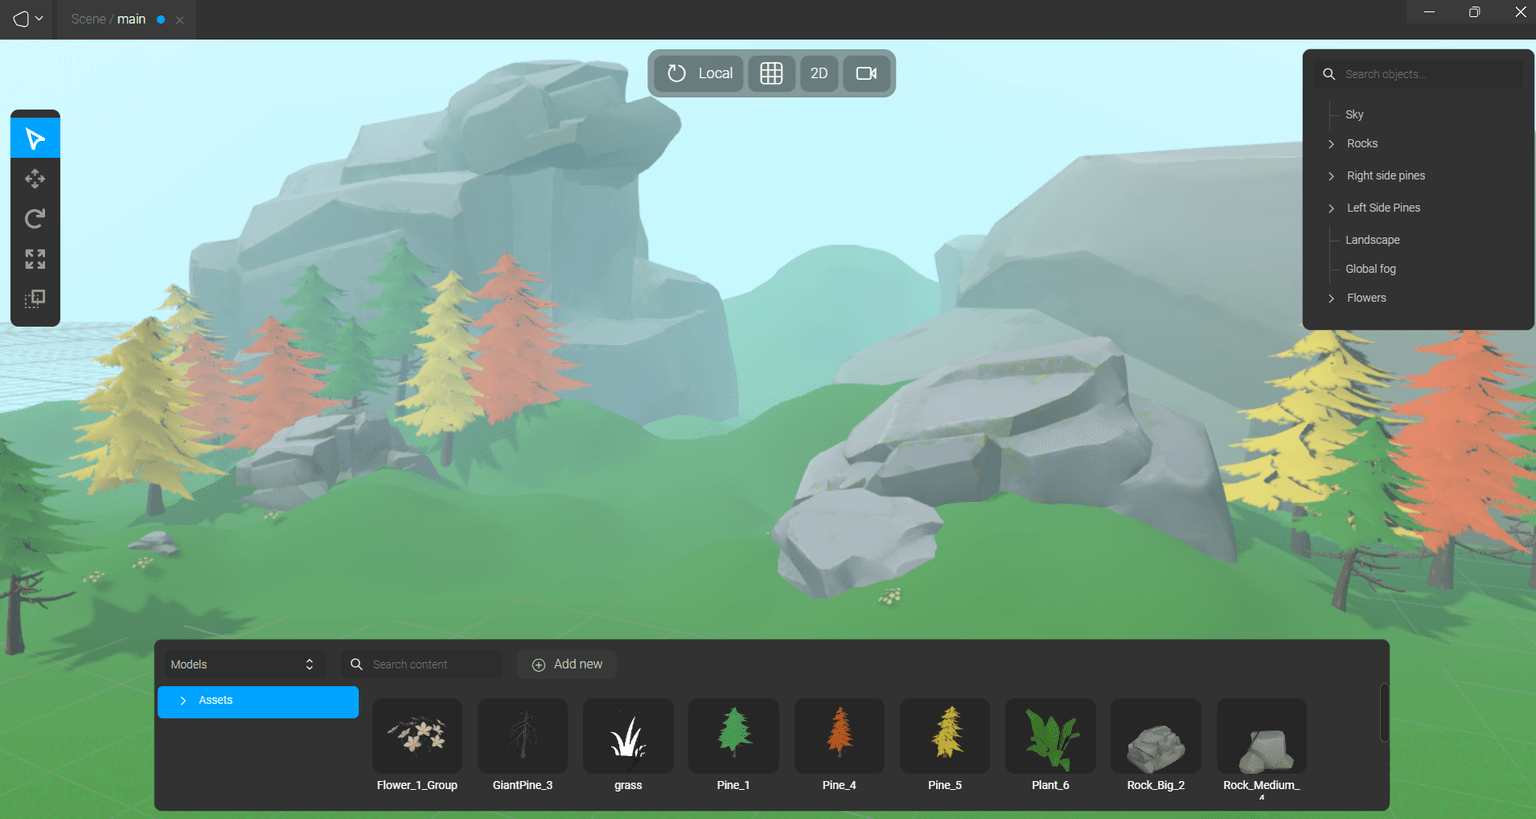
Hology Engine
Create 3D games and experiences for web, mobile and VR by using web technologies with Hology Engine.
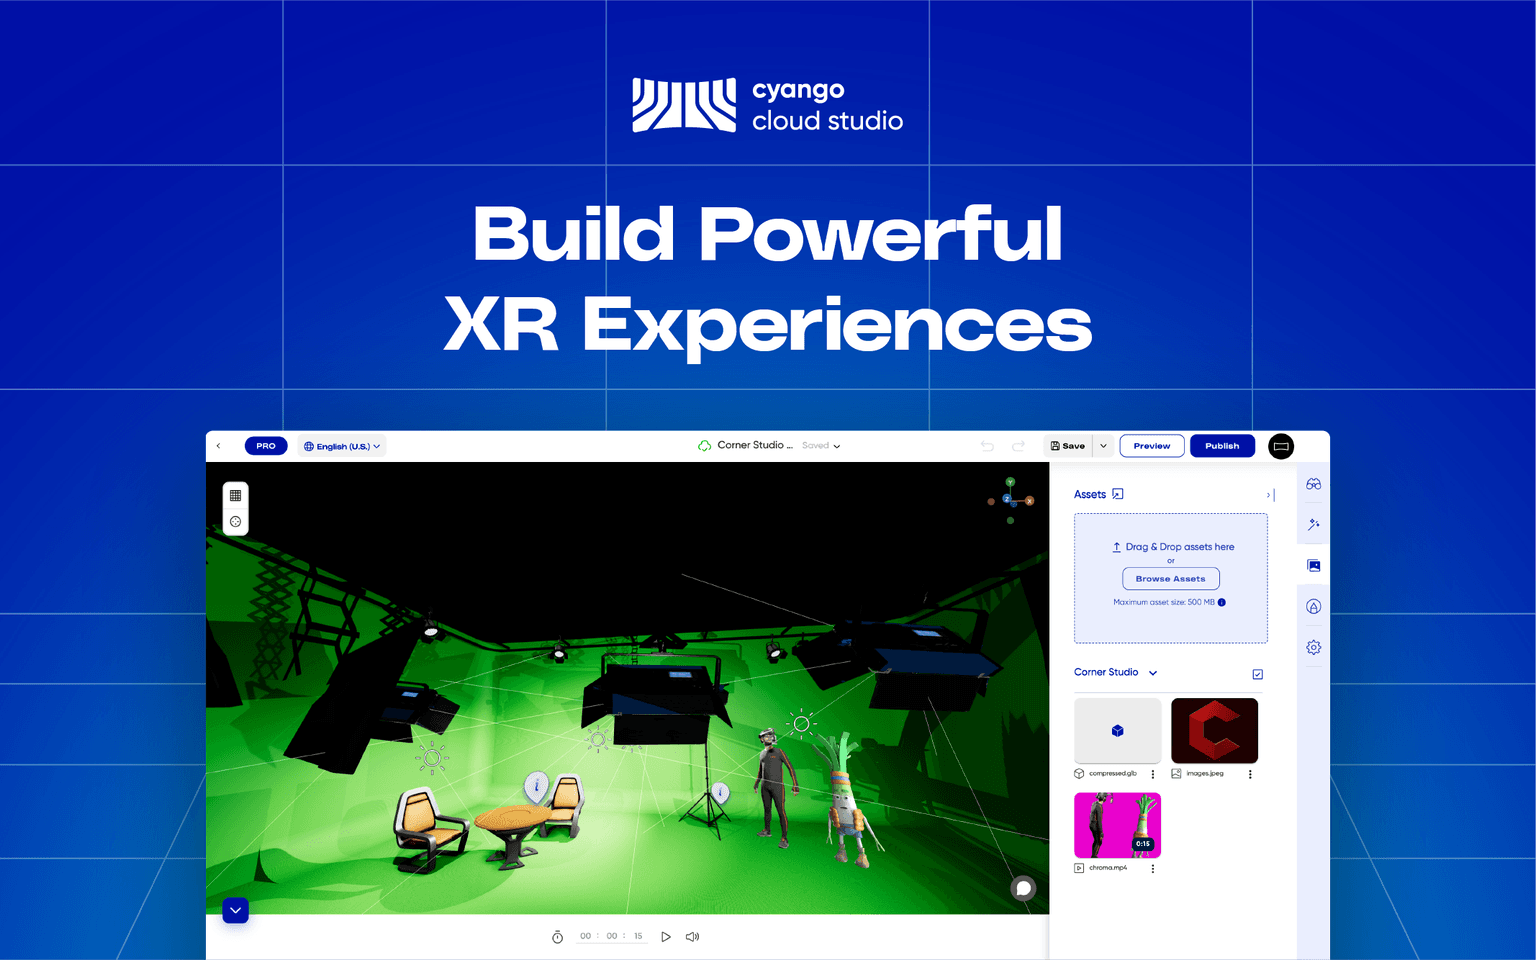
Cyango
All-in-one Experiences Builder. From 2D to 3D, you can build and export full mobile and web apps.